Plan vs actual hours by month
Planned hours (Planisware)Booked hours (SAP PS)Month over plan
Where the hours go
PlanActualRemaining (ETC)
Bearing race — every project in one look
Outer race: hours consumed % of plan · Middle: schedule elapsed % · Inner: material cost consumed %
On trackHours running >10 pts ahead of scheduleOver plan hoursNot yet started / complete
What this board answers
Capacity — next 90 days (Sep–Nov 2026)
Remaining plan hours booked vs available engineering hours by discipline · design disciplines show free capacity for builds not yet in Planisware
Remaining time by project
Estimate-to-complete (ETC) vs months to planned end
SAP PS · actual hours & purchases→
Planisware · plan hours & material cost→
Dataflow · WBS ↔ activity mapping→
Power BI · this board, daily 06:00
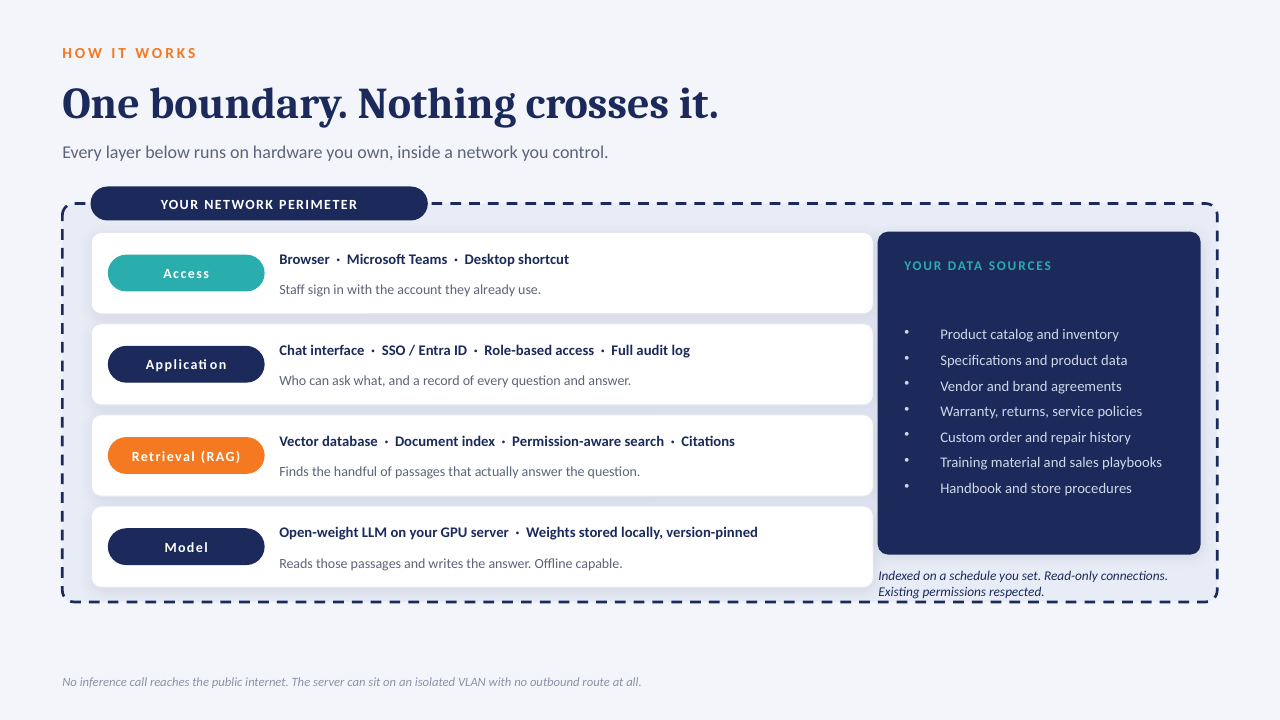
One semantic model, row-level security by project group. Illustrative architecture.